


Contact
Privacy
Legal Notice - Impressum
Career
News

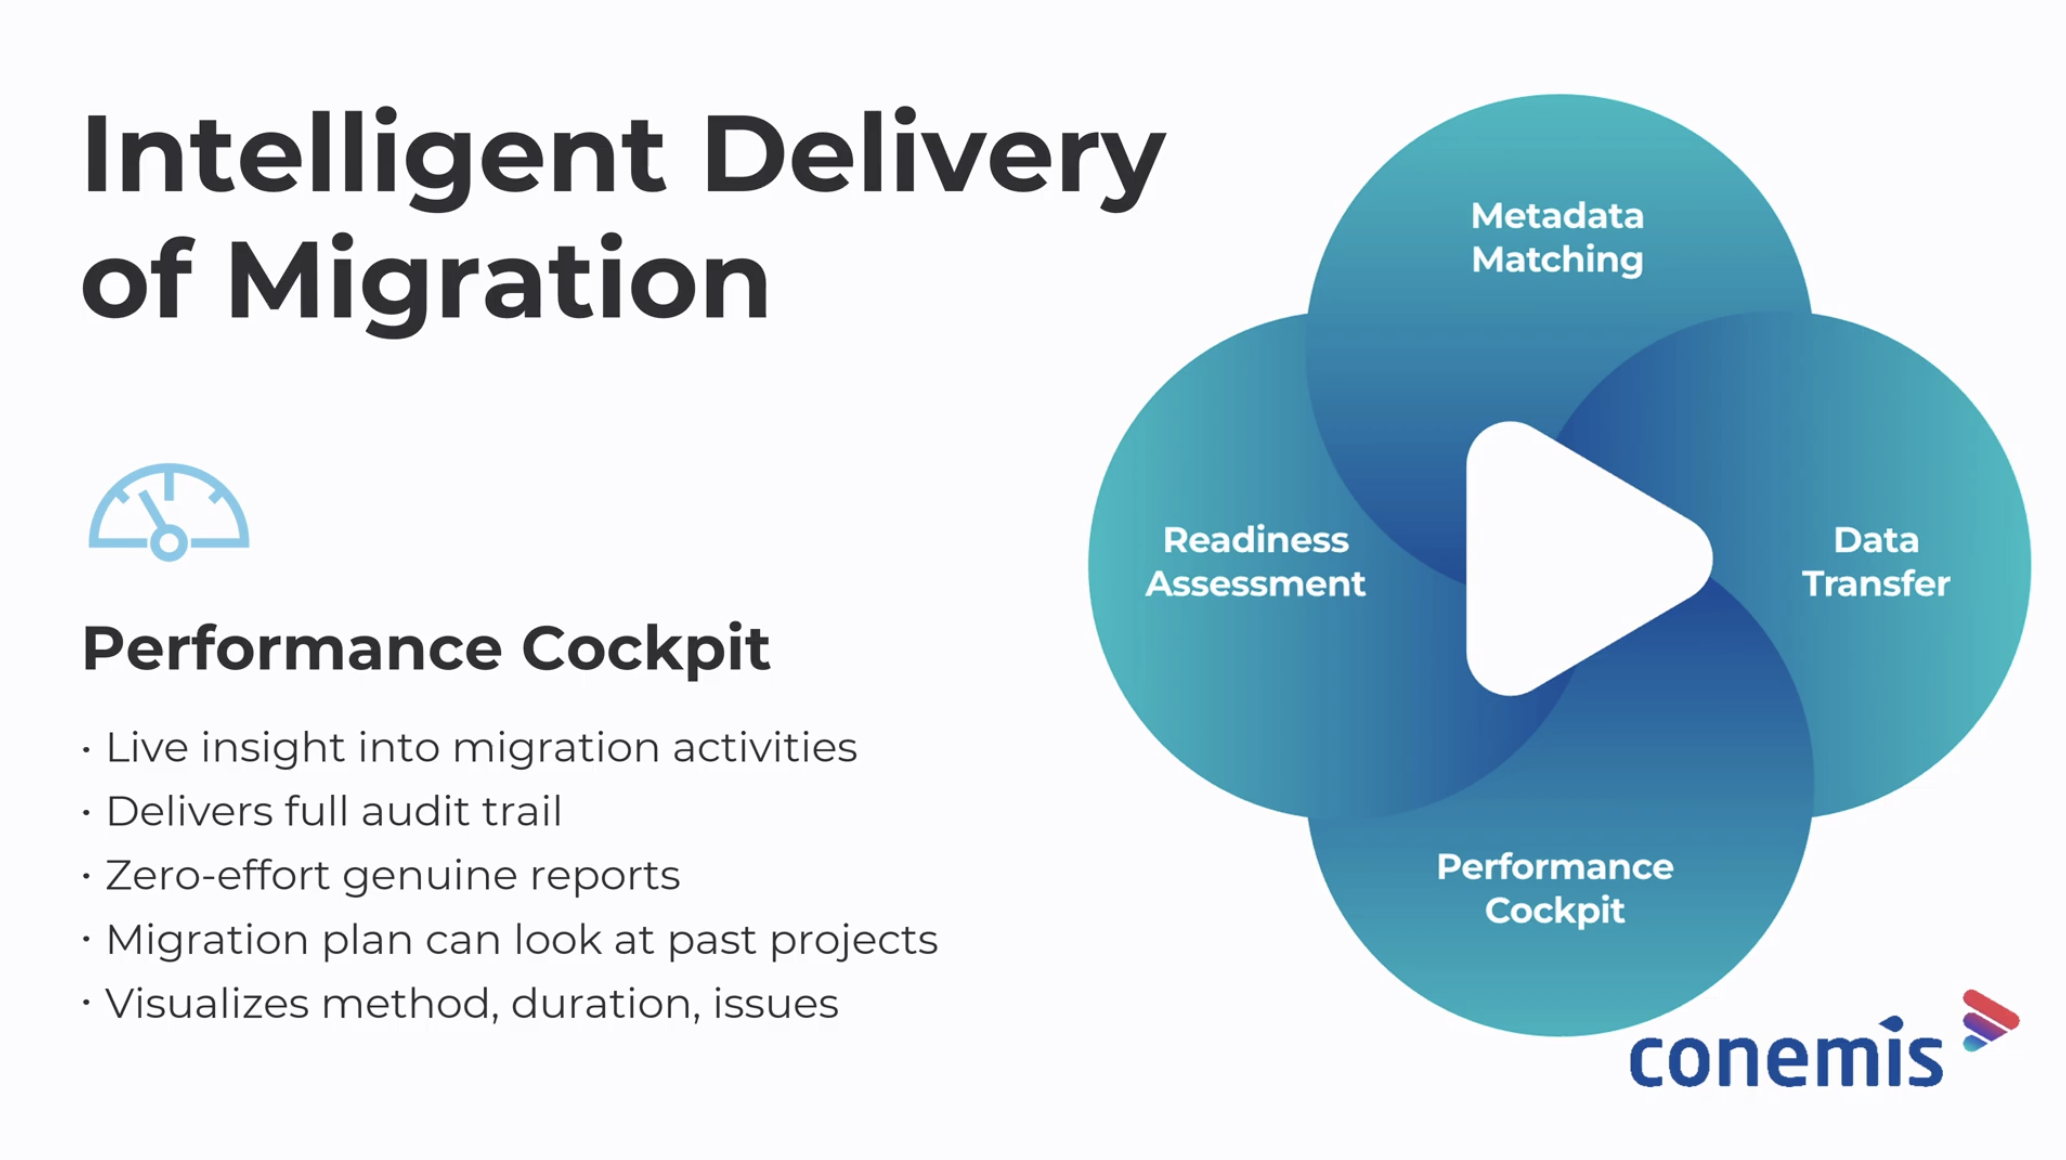
Most data migration projects rely on manual status reports that lag days behind actual progress. Real-time data migration tracking built into the migration platform replaces that delay with live visibility into every object, connection, and milestone, giving project managers the information they need to act before problems escalate.
Migration project managers face a recurring problem: they cannot see what is actually happening until someone compiles a report. The gap between an activity occurring and a manager learning about it creates risk. A late milestone, unexpected activity on a test instance during production runs, or a failing object can go unnoticed for days when the only reporting mechanism is a spreadsheet or a slide deck updated weekly.
conemis transition cloud (ctc) addresses this with its Performance Cockpit, a module that captures every migration activity automatically and presents it in real time. In the video below, we walk through the Performance Cockpit in a live environment, showing how it gives project owners, project managers, and customers direct insight into migration progress without waiting for manual reports.
This article is part two of our ctc module walkthrough series. Part one covers the Data Transfer module, which handles automated extraction, transformation, and loading.
Visibility breaks down when reporting depends on manual effort rather than automated capture. Most migration projects track progress through spreadsheet-based status updates, slide decks, or periodic meetings where a project manager summarizes what happened since the last review. Each of these methods introduces delay between what is happening and what stakeholders see.
Salesforce's own data migration best practices guide emphasizes validation, exception reporting, and dependency-aware sequencing as critical steps. In practice, validation logs, error counts, and milestone status are often scattered across tools with no single view tying them together. The project manager assembles the picture manually, and by the time it reaches stakeholders, the data is stale.
This matters most in large-scale programs. When Catella consolidated eight CRM systems into a single Salesforce platform with ctc, the project involved multiple source connections, a test instance, and a production environment running in parallel. A weekly status report could not have kept pace with that level of concurrent activity.
The Performance Cockpit provides two complementary views: a visual activity timeline and a quantitative control center. Both update automatically whenever an action occurs in ctc, with no additional input from users.
The timeline displays every migration activity as it occurs, color-coded by phase. Each connection (source system, test instance, production instance) occupies its own lane, so a manager can see at a glance where work is active across the project.
Milestones appear on the timeline as well. In the demo, the "complete test loads" milestone arrived late, but the team recovered and met the go-live date. That pattern, delay followed by on-time delivery, is visible in seconds without asking anyone to compile a summary.
The control center provides the numbers behind the timeline: activity count compared to plan, total processed records, and the degree of completion for each object. Drilling into a specific object, Account for example, shows created records, updated records, records with warnings, deleted records, and overall object progress, per conemis project data.
The video walks through both views end to end.
Automated tracking makes every activity visible the moment it happens, so the information is already there when a project manager checks. Two capabilities in the Performance Cockpit make this concrete.
The timeline makes irregular activity patterns visible without anyone actively searching for them. The demo shows a specific example: activity on the testing instance while production runs are in progress. That overlap could indicate a scope change, a late fix, or an error. In a traditional reporting setup, it would not surface until someone thought to ask.
When a pattern triggers a question, the project manager can expand the relevant connection lane, identify the object involved, and inspect the individual activity record, all within the same interface. In the demo, the suspicious testing activity turns out to be a six-record update on the Event object. The investigation takes seconds rather than a meeting.
Together, these capabilities mean ctc does not just move data. It provides the migration project management layer that most tooling leaves to external processes.
Traditional ETL tools and manual migration setups generate reports after the fact. Someone exports logs, compiles record counts, cross-references error files, and builds a slide. That process costs hours per reporting cycle and still delivers a snapshot, not a live view.
The Performance Cockpit captures every action taken in ctc automatically. There is no additional step for users. As soon as an extraction, mapping, or load activity runs, it appears in the timeline and the control center. Project managers, project owners, and customers all see the same data at the same time.
For teams running iterative migration cycles, test loads, delta loads, production cutover, each cycle's progress is tracked and comparable without rebuilding a report from scratch.
Watch the Performance Cockpit demo to see this in a live environment. To explore how ctc fits your migration scenario, request a personalized demo or contact the conemis team.